This module is a resource for lecturers
The history of the legitimate arms market
Pre-Cold War
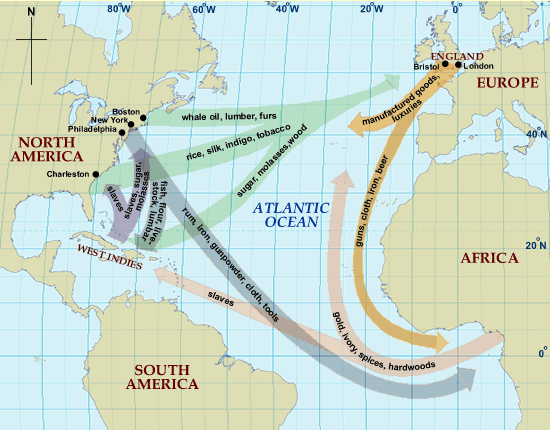
European traders laid down the foundation of the international arms trade in the 16 th and 17 th Centuries when they started shipping arms to African, American, and to a lesser extent, Asian markets (Grant, 2012: 1). This trade formed one arm of the " triangular trade" where Britain shipped goods such as firearms, cloth and beer to Africa, slaves and other goods were shipped to the Americas, and other goods then shipped back to Britain. The map below represents the trade from Britain, but most European nations with overseas territories operated similar patterns of trade.

Figure 3.1 Map of the triangular trade routes from Britain to Africa and the Americas. The National Archives.
Technological developments played a role in the development of the arms trade. In the late 18 th Century, the boring machinery of John Wilkinson produced more accurate smooth-bore firearms (Grace's Guide to British Industrial History, 2018), before being superseded by even more accurate rifled firearms in the 19 th Century; for example, the Whitworth rifle, produced between 1854 and 1857, subsequently used in the American Civil War. As Brose (2014: 1) notes, these developments in arms also had significant impact on international relations in Europe at that time:
New weapons produced during the Industrial Revolution in the late 1800s heightened existing tensions among European nations as countries strove to outpace their enemies technologically. This armaments race accelerated in the decade before 1914 as the Triple Alliance of Germany, Austria-Hungary, and Italy squared off against the Triple Entente of France, Russia, and Britain .
The First World War provided an increased demand for firearms, and the trade became very much divided between the blocks of allies. After initially remaining neutral in the conflict, United States President Wilson asked Congress to declare war on Germany in April 1917, but even before this formal declaration of war, American firms had been permitted to sell arms and ammunition to the Allied powers (Klare, 2018). The Allied Powers took full advantage of this as a way of bolstering their own production: " American military exports jumped from $40 million in 1914 to $1.3 billion in 1916 and $2.3 billion in the final nineteen months of war", marking the beginnings of a significant role in the international weapons trade for American arms manufacturers (Klare, 2018: 1).
In the years leading up to the First World War, arms manufacturing companies were mostly privately owned, and apart from standard controls on trade, were generally uncontrolled by either their home government or any international controls. Below are examples of such arms manufacturers in the big six players in the First World War:
- Austria-Hungary: Mannlicher Model 1895, made by Steyr Mannlicher (private);
- Britain: Lee-Enfield .303 made by Royal Small Arms Factory / Birmingham Small Arms Company (private);
- France: Lebel Fusil Modele 1886, made by state owned factories;
- Germany: Maschinengewehr 08, made by Deutsche Waffen- und Munitionsfabriken Aktien-Gesellschaft (private) and Spandau Arsenal (State Owned);
- Italy: Carcano Modello 1891, made by a state owned factory in Turin;
- Russia: Mosin-Nagant M1891, and Pulemyot Maxim, both made by the Tule Arsenal.
Whilst the inter-war years saw a drop in the number of large-scale conflicts, several regional conflicts still used firearms. The Spanish Civil War, for example, saw firearms exported by a Greek arms manufacturer with ties to the German hierarchy, notably Hermann Göring. The Greek Powder and Cartridge Company (GPCC), under Prodromos Bodosakis-Athanasiadis, exported to Spain with the best and most up-to-date weapons going to Franco, while the oldest and least serviceable arms went to the Republicans (Grant, 2012). Göring meanwhile supplied " 19,000 rifles, 101 machine guns and 28 million cartridges" in a secret arm deal to the Republicans from GPCC's partner company in Germany, and the Greek Government provided fictitious end-user certificates stating that the arms were for the Greek army (Grant, 2012: 2). This ostensibly legitimate transfer provided a cover for a large-scale illegitimate transfer.
It would be easy to assume that the Second World War saw those countries directly involved in trading forming two distinct groupings - the allied forces (United Kingdom, United States, France and their allies), and the Axis forces (Germany, Italy, Japan and their allies). However, there were also several countries (e.g. Afghanistan, Sweden and Switzerland) which remained politically neutral during the war and did not play an active role in the conflict, and neutrality was not always absolute; for example, Swiss arms manufacturers sold weapons to both sides of the conflict - about CHF600m to Germany and Italy, and CHF300m to the Allies (Cowell, 1997).
Cold-War period
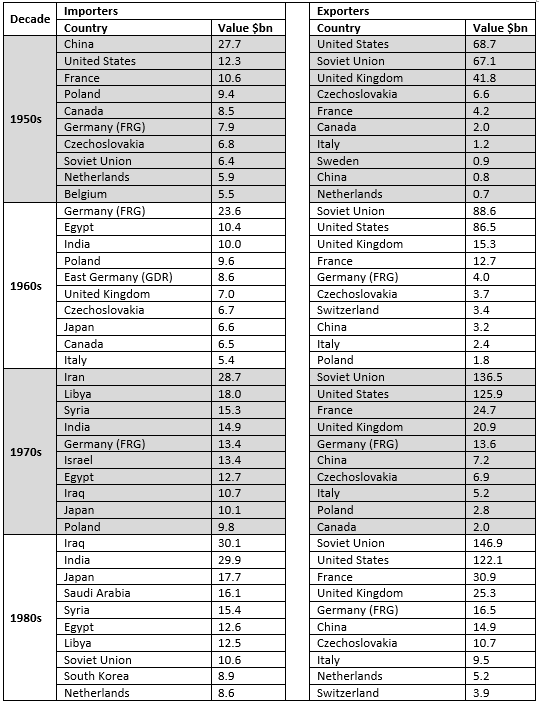
During Cold-War period, the United States and the Soviet Union became the main exporters of arms (see Table 3.1 below). Given that these two States were the major players during the Cold War, both were exporting arms to their respective allies in several proxy conflicts, from Vietnam to Afghanistan. Meanwhile, top importers of arms were more changeable over the period: China, the United States, former West Germany, Egypt, Iran, Libya, Iraq and India all occupied the top two positions in different decades. The reasons for these changes in imports vary but could point to enhanced security concerns (for example, Egypt in the 1960s), or conflict (for example, Iran and Iraq in the 1970s and 1980s).
It is important to note that the data from the Stockholm International Peace Research Institute (SIPRI) presented in the Table 3.1 covers all major conventional arms (battle tanks, armoured combat vehicles, large-calibre artillery systems, combat aircraft, attack helicopters, warships, missiles and missile launchers), as well as small arms and light weapons. Thus, within these figures firearms (small arms) will account for a proportion of the total figure, but not the whole. The Small Arms Survey Trade Updates, released in 2016 and 2017, provide specific data on imports and exports of small arms, so Section 3 below will use those figures.

Table 3.1 Top 10 Cold War arms importers and exporters by decade, from SIPRI data
Several authors go on to make the interesting point that small arms manufacturing became much more of a global business venture in the Cold War period, noting that " By the mid-1980s, inter-industry agreements were replacing inter-governmental agreements on arms production collaboration. The transfer of technology, technical data, and industrial know-how became the new form of exchange between states and defence companies, thus transforming arms production into a more transnational endeavour" (Kurç and Neuman, 2017: 219). Despite the figures being produced on a per-country basis, this meant that the same firearm could be made under licence by different producers in different countries with the same type of firearm being exported by different countries to the same destination.
Possibly the most ubiquitous firearm of recent years is the AK-47. It was assessed in 2007 that of the " estimated 500 million firearms worldwide, approximately 100 million belong to the Kalashnikov family, three-quarters of which are AK-47, which puts the number of AK-47 in circulation at around 75 million" (Killicoat, 2007: 3).
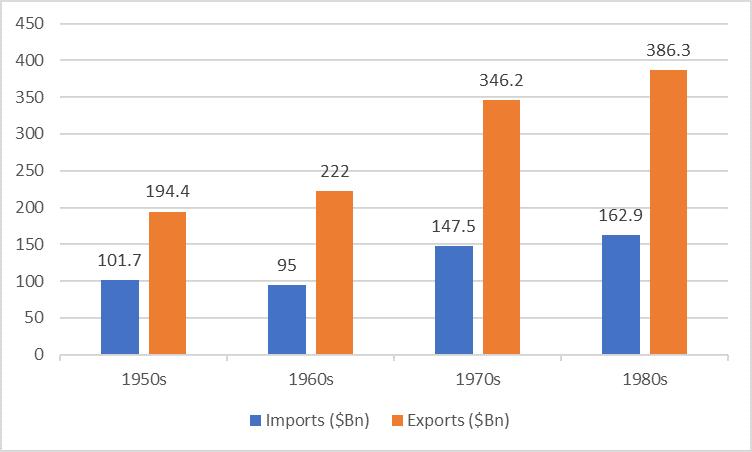
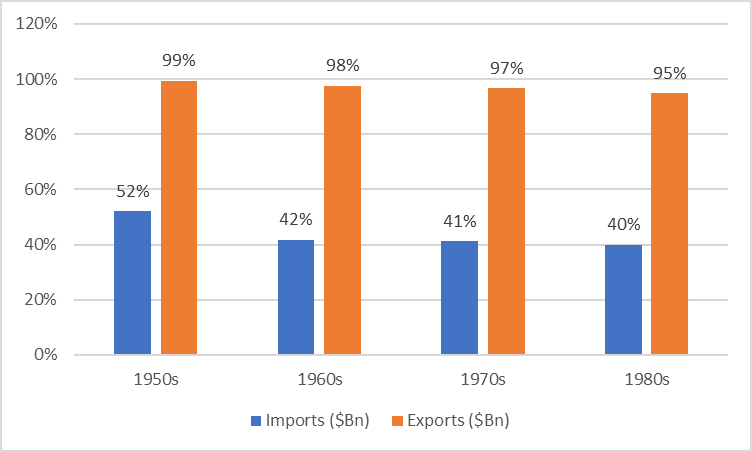
What Table 3.1 also illustrates is the growth in exports and imports of arms. Figure 3.2 below graphically represents the totals for the top ten exporting and importing countries for each decade, and Figure 3.3 shows the percentage of the total recorded imports and exports that is attributable to these countries in these decades.

Figure 3.2: The total of the top ten arms importing and exporting countries by decade, $Bn. Data from SIPRI
Figure 3.2 shows that the financial value of exports by the top ten exporting states rose sharply during the Cold War period, and this economic benefit will be explored in the next section of the Module.

Figure 3.3: The percentage of total arms imports and exports by decade attributable to the top ten countries, $Bn. Data from SIPRI
What Figure 3.3 illustrates clearly is that the domination of the Cold War arms trade by a small number of producers and exporters is not reflected in the importing countries, which are much more widely spread.
 Next:
The need for a legitimate market
 Back to top